 #
#


gdptools is a Python package for calculating area-weighted statistics and spatial interpolations between gridded datasets and vector geometries. It provides efficient tools for grid-to-polygon, grid-to-line, and polygon-to-polygon interpolations with support for multiple data catalogs and custom datasets.
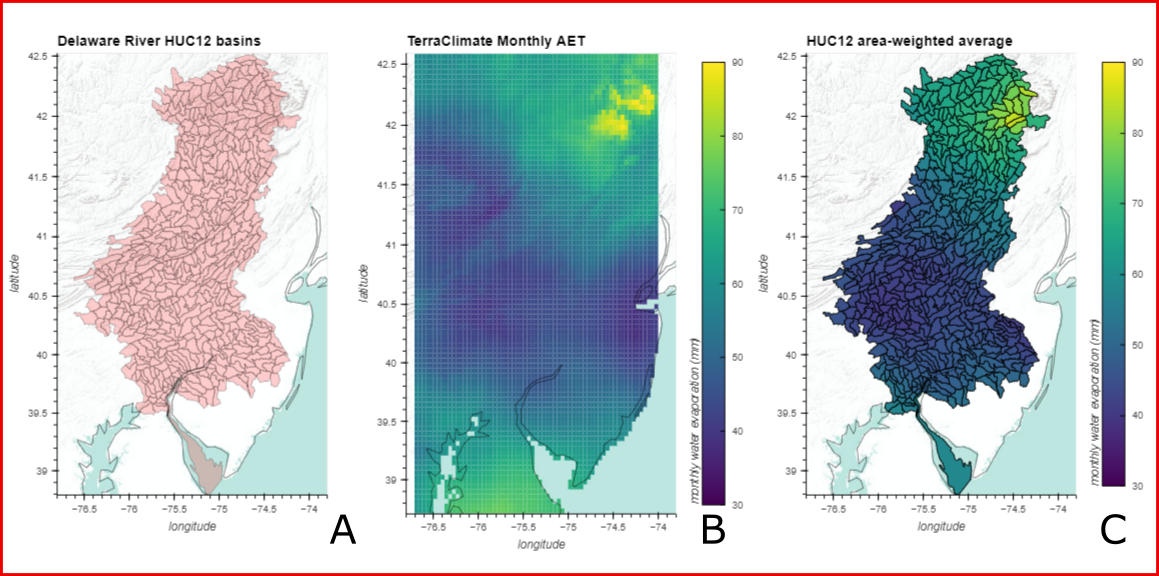
Fig. 1 Example grid-to-polygon interpolation. A) HUC12 basins for Delaware River Watershed. B) Gridded monthly water evaporation amount (mm) from TerraClimate dataset. C) Area-weighted-average interpolation of gridded TerraClimate data to HUC12 polygons.#
🚀 Key Features#
Multiple Interpolation Methods: Grid-to-polygon, grid-to-line, and polygon-to-polygon area-weighted statistics
Catalog Integration: Built-in support for U.S. Geological Survey’s NHGF-STAC catalog, Mike Johnson’s ClimateR catalog, and custom metadata
Flexible Data Sources: Works with any xarray-compatible gridded data and geopandas vector (line and polygon) data
Scalable Processing: Serial, parallel, and Dask-based computation methods
Multiple Output Formats: NetCDF, CSV, Parquet, and in-memory results
Extensive vs Intensive Variables: Proper handling of different variable types in polygon-to-polygon operations
Intelligent Spatial Processing: Automatic reprojection to equal-area coordinate systems and efficient spatial subsetting
🌍 Spatial Processing & Performance#
gdptools automatically handles complex geospatial transformations to ensure accurate and efficient calculations:
Automatic Reprojection#
Equal-Area Projections: Both source gridded data and target geometries are automatically reprojected to a common equal-area coordinate reference system (default: EPSG:6931 - Equal-Area Scalable Earth Grid (EASE-Grid)
Accurate Area Calculations: Equal-area projections ensure that area-weighted statistics are calculated correctly, regardless of the original coordinate systems
Flexible CRS Options: Users can specify alternative projection systems via the
weight_gen_crsparameter
Efficient Spatial Subsetting#
Bounding Box Optimization: Gridded datasets are automatically subset to the bounding box of the target geometries plus a buffer
Smart Buffering: Buffer size is calculated as twice the maximum grid resolution to ensure complete coverage
Memory Efficiency: Only the necessary spatial extent is loaded into memory, reducing processing time and memory usage for large datasets
📦 Installation#
Quick Installation#
# Via conda (recommended)
conda install -c conda-forge gdptools

# Via pip
pip install gdptools
🚀 Quick Start#
🔧 Core Components#
Data Classes#
ClimRCatData: Interface with ClimateR catalog datasetsNHGFStacData: Interface with NHGF STAC catalog datasetsUserCatData: Custom user-defined gridded datasetsUserTiffData: GeoTIFF/raster data interface
Processing Classes#
WeightGen: Calculate spatial intersection weightsAggGen: Perform area-weighted aggregationsInterpGen: Grid-to-line interpolation along vector paths
📚 Documentation Structure#
Getting Started: Installation, core concepts, and first examples
API Reference: Complete documentation of all classes and functions
🗄️ Data Sources#
gdptools integrates with multiple climate and environmental data sources:
ClimateR Catalog: TerraClimate, GridMET, Daymet, PRISM, and more
NHGF STAC Catalog: Cloud-optimized CONUS404, observational data, climate projections
Custom Datasets: Your own NetCDF, Zarr, or GeoTIFF files
💡 Use Cases#
Climate Analysis: Aggregate weather/climate data over watersheds, counties, or custom regions
Environmental Monitoring: Calculate zonal statistics from satellite imagery and gridded datasets
Hydrological Modeling: Transfer data between different spatial frameworks (HUCs, model grids, etc.)
Impact Assessment: Interpolate climate projections to administrative boundaries
Research Applications: Process custom model outputs and observational datasets
🤝 Contributing#
We welcome contributions! Please see our contributing guide for development setup, testing procedures, code style guidelines, and issue reporting.
📄 License#
This project is in the public domain. See LICENSE for details.
⚠️ Disclaimer#
This software is preliminary or provisional and is subject to revision. See our full disclaimer for important usage information.
🙏 Acknowledgments#
gdptools integrates with several excellent open-source projects:
xarray: Multi-dimensional array processing
geopandas: Geospatial data manipulation
HyRiver: Hydrologic data access (pynhd, pygeohydro)
STAC: Spatiotemporal asset catalogs
ClimateR: Climate data catalogs
Questions? Open an issue on our GitLab repository or check the documentation for detailed examples and API reference.